IELTS Academic Writing Task 1/ Graph Writing - Column Graph:
» You should spend about 20 minutes on this task.
The diagram below shows the average hours of unpaid work per week done by people in different categories. (Unpaid work refers to such activities as childcare in the home, housework and gardening.)
Describe the information presented below, comparing results for men and women in the categories shown. Suggest reasons for what you see.
» You should write at least 150 words.
Model Answer 1:
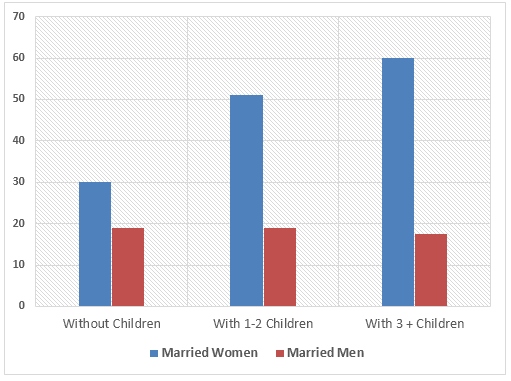
The graph shows data between married men and women of the number of hours spent per week on unpaid work. At first glance at the chart, it is noticeable that from all the three categories (without children, with 1-2 children and with 3 or more children), married women spend more hours involved in unpaid work such as housework, gardening and childcare than expected from men.
Married women with children spend more time than without children as the chart shows while having more than three children have invested around 60 hours of unpaid work. This is probably due to the extra load of housework and childcare that is evidently needed to run such a big family.
Furthermore, though there are visible variations of the number of hours of unpaid work carried out by married women, there is no significant variation among all three categories for married men in terms of work hours that are not paid (30 or fewer hours). In fact, it is observed that married men with three or more children spent slightly less number of unpaid work hours. This might be due to the high requirement of commitment needed for a paid job to meet financial requirements for a big family.
In conclusion, married women with three or more children spent the highest number of hours, yet married women from all categories spent a dramatically higher number of hours for unpaid work than married men.
[Written by - Menu Anju ]
Tips for answering this Academic IELTS writing task 1:
1. Look at the question carefully. It asks you to compare the result shown for men and women. So you should not only mention the figures given in the graph. Rather you should use comparisons. An example of comparison is: "The number of unpaid working hours increases for women with the increase of their children's number but that does not affect the total unpaid works done by the men."
2. The question also asks you to suggest reasons for what you see. So you would require giving reasons possibly why the women work more unpaid works that men do and why their working hours in unpaid works increases with the number of total children.
3. There is an interesting fact in the result of the bar graph i.e. men with more than 3 children work even less for the unpaid jobs. Mention this interesting fact in your writing.
4. Since no past year or month is mentioned in this bar graph, your answer should be in present tense. Example: Women spend more time on such unpaid household works than men do.
Summary of the bar graph:
This graph shows the total hour of unpaid jobs like child rearing, household works, cooking, cleaning, gardening etc done by male and female per week. The result of this graph is not related to the paid job of men of women. The result suggests that females spend more time on such jobs than men do. Again, female with more children works more hours than other females. Interestingly the numbers of hours men work in such unpaid works remain almost same regardless of their children number.
This graph shows the total hour of unpaid jobs like child rearing, household works, cooking, cleaning, gardening etc done by male and female per week. The result of this graph is not related to the paid job of men of women. The result suggests that females spend more time on such jobs than men do. Again, female with more children works more hours than other females. Interestingly the numbers of hours men work in such unpaid works remain almost same regardless of their children number.
Model Answer 2:
The given column graph elucidates the unpaid work done by both married men and women having different numbers of children. A cursory glance is adequate to mention that most women, with or without children, have to do the unpaid household works more than men and more children mean more work for women.
The given column graph elucidates the unpaid work done by both married men and women having different numbers of children. A cursory glance is adequate to mention that most women, with or without children, have to do the unpaid household works more than men and more children mean more work for women.
As is seen in the given illustration, married females who do not have any child do around 30 hours of unpaid work weekly, while, male from the same category do only 18 hours of such work. Whilst, men who have one or two children spend an equal amount of time for household works as do the males without children, this is in contrast nearly fifty hours for women. In the case of women, who nurture more than three offspring, spend the highest hours on unpaid works -58 hours per week. Men on the other hand, surprisingly do fewer household works with the increase of their child number.
[Word count = 152]
No comments:
Post a Comment