IELTS Training

Saturday, May 26, 2018

IELTS Listening Sample 1

SECTION 1

  Section One - Questions 1-10

Questions 1-5 

Write NO MORE THAN ONE WORD

VIDEO LIBRARY APPLICATION FORM

EXAMPLE              ANSWER    
Surname                 Jones

First names:     Louise Cynthia
                                       
Address:     Apartment 1, 72 (1) ...................................... Street Highbridge   

Post code:    (2) ......................................

Telephone:    9835 6712 (home)            (3) ...................................... (work)

Driver's licence number:       (4)  ......................................

DOB: 25th Month:   (5) ...................................... Year: 1977


Questions 6—8    
Write THREE letters A-F.

What types of films does Louise like?
  Action
B   Comedies
C   Musicals
  Romance
E   Westerns
F   Wildlife

Questions 9 and 10 
Write NO MORE THAN 3 WORDS .

9.  How much does it cost to join the library?
10. When will Louise's card be ready?


SECTION 2

Section Two - Questions 11-20

Questions 11-13
Write NO MORE THAN THREE WORDS for each answer.

Expedition Across Attora Mountains

Leader:    Charles Owen
Prepared a   (11) ...........................................  for the trip
Total length of trip   (12) ................................
Climbed highest peak in   (13) ...................................

Questions 14 and 15 
Circle the correct letters A-C.    

14.   What took the group by surprise?
      A the amount of rain            
      B the number of possible routes                        
      C the length of the journey    
      
15.   How did Charles feel about having to change routes?
      A He reluctantly accepted it.              
      B He was irritated by the diversion.                   
      C It made no difference to enjoyment.

Questions 16—18
Write THREE letters A-F.

What does Charles say about his friends?
A   He met them at one stage on the trip.                             
B   They kept all their meeting arrangements.
C   One of them helped arrange the transport.                     
D   One of them owned the hotel they stayed in.
E   Some of them travelled with him.                                   
F   Only one group lasted the 96 days.

Questions 19 and 20
Write TWO letters, A-E.

What does Charles say about the donkeys?
A   He rode them when he was tired                                    
B   He named them after places.          
C   One of them died.                                                            
D   They behaved unpredictably.                          
  They were very small.      


SECTION 3

Section Three - Questions 21-30
Questions 21-25 
Write NO MORE THAN THREE WORDS for each answer.
Tim
Jane
Day of arrival
Sunday
(21) ...........................
Subject
History
(22) ...........................
Number of books to read
(23) ...........................
(24) ...........................
Day of first lecture
Tuesday
(25) ...........................
Questions 26-30
Write NO MORE THAN THREE WORDS for each answer.
26. What is Jane's study strategy in lectures?     
27. What’s Tim's study strategy for reading?
28. What is the subject of Tim's first lecture? 
29. What’s the title of Tim's first essay?
30. What is the subject of Jane's first essay?


SECTION 4

Section Four - Questions 31-40
Questions 31-35
Write NO MORE THAN THREE WORDS for each answer.
Course
Type of course: duration & level
Entry requirements
Physical Fitness Instructor
Example  Six-month certificate
None
Sports Administrator
(31) ...............................
(32) ............................... in sports administration
Sports Psychologist
(33) ...............................
Degree in psychology
Physical Education Teacher
4 years degree in education
(34) ...............................
Recreation officer
(35) ...............................
None

Questions 36-40 
Write the appropriate letters A-G against question 36- 40. 

MAIN ROLES                                            __                        
    
Job                                                                     Main Role
Physical Fitness Instructor                                    (36)
Sports Administrator                                             (37)
Sports Psychologist                                              (38)
Physical Education Teacher                                   (39)
Recreation Officer                                                  (40)
A   the coaching of teams       
B   the support of elite athletes
C   guidance of ordinary individuals
D   community health
  the treatment of injuries
F   arranging matches and venues
G   the rounded development of children


Click For Answers

IELTS Academic Reading Sample 1

You should spend about 20 minutes on Questions 28-39 which are based on Reading Passage 1 below:

Population Viability Analysis

Part A
To make political decisions about the extent and type of forestry in a region it is important to understand the consequences of those decisions. One tool for assessing the impact of forestry on the ecosystem is population viability analysis (PVA). This is a tool for predicting the probability that a species will become extinct in a particular region over a specific period. It has been successfully used in the United States to provide input into resource exploitation decisions and assist wildlife managers and there is now enormous potential for using population viability to assist wildlife management in Australia’s forests. A species becomes extinct when the last individual dies. This observation is a useful starting point for any discussion of extinction as it highlights the role of luck and chance in the extinction process. To make a prediction about extinction we need to understand the processes that can contribute to it and these fall into four broad categories which are discussed below.
Part B
     A)   Early attempts to predict population viability were based on demographic uncertainty whether an individual survives from one year to the next will largely be a matter of chance. Some pairs may produce several young in a single year while others may produce none in that same year. Small populations will fluctuate enormously because of the random nature of birth and death and these chance fluctuations can cause species extinctions even if, on average, the population size should increase. Taking only this uncertainty of ability to reproduce into account, extinction is unlikely if the number of individuals in a population is above about 50 and the population is growing.
B)   Small populations cannot avoid a certain amount of inbreeding. This is particularly true if there is a very small number of one sex. For example, if there are only 20 individuals of a species and only one is a male, all future individuals in the species must be descended from that one male. For most animal species such individuals are less likely to survive and reproduce. Inbreeding increases the chance of extinction.
     C)   Variation within a species is the raw material upon which natural selection acts. Without genetic variability, a species lacks the capacity to evolve and cannot adapt to changes in its environment or to new predators and new diseases. The loss of genetic diversity associated with reductions in population size will contribute to the likelihood of extinction.
    D)   Recent research has shown that other factors need to be considered. Australia’s environment fluctuates enormously from year to year. These fluctuations add yet another degree of uncertainty to the survival of many species. Catastrophes such as fire, flood, drought or epidemic may reduce population sizes to a small fraction of their average level. When allowance is made for these two additional elements of uncertainty the population size necessary to be confident of persistence for a few hundred years may increase to several thousand.
Part C
Besides these processes, we need to bear in mind the distribution of a population. A species that occurs in five isolated places each containing 20 individuals will not have the same probability of extinction as a species with a single population of 100 individuals in a single locality. Where logging occurs (that is, the cutting down of forests for timber) forest-dependent creatures in that area will be forced to leave. Ground-dwelling herbivores may return within a decade. However, arboreal marsupials (that is animals which live in trees) may not recover to pre-logging densities for over a century. As more forests are logged, animal population sizes will be reduced further. Regardless of the theory or model that we choose, a reduction in population size decreases the genetic diversity of a population and increases the probability of extinction because of any or all of the processes listed above. It is therefore, a scientific fact that increasing the area that is loaded in any region will increase the probability that forest-dependent animals will become extinct.
Questions 28-31:
Do the following statements agree with the views of the writer in Part A of Reading Passage 1? In boxes 28-31 on your answer sheet write:
YES                if the statement agrees with the writer
NO                  if the statement contradicts the writer
NOT GIVEN    if it is impossible to say what the writer thinks about this
Example                                                                                                                Answer
A link exists between the consequences of decisions and the                                        YES
decision making process itself.                                                                             
28.   Scientists are interested in the effect of forestry on native animals.
29.   PVA has been used in Australia for many years.
30.   A species is said to be extinct when only one individual exists.
31.   Extinction is a naturally occurring phenomenon. 
Questions 32-35:
These questions are based on Part B of Reading Passage 1. In paragraphs A to D the author describes four processes which may contribute to the extinction of a species. Match the list of processes (i-vi) to the paragraphs. Write the appropriate number (i-vi) in boxes 32-35 on your answer sheet.
NB. There are more processes than paragraphs so you will not use all of them.
32.   Paragraph A
33.   Paragraph B
34.   Paragraph C
35.   Paragraph D
Processes
i   Loss of ability to adapt
ii   Natural disasters
iii   An imbalance of the sexes
iv   Human disasters
v   Evolution
vi  The haphazard nature of reproduction
Questions 36-38:
Based on your reading of Part C, complete the sentences below with words taken from the passage. Use NO MORE THAN THREE WORDS for each answer. Write your answers in boxes 36-38 on your answer sheet.
While the population of a species may be on the increase, there is always a chance that small isolated groups .......... (36) .......... Survival of a species depends on a balance between the size of a population and its .......... (37) .........The likelihood that animals which live in forests will become extinct is increased when ..........  (38) ...........
Question 39:
Choose the appropriate letter A-D and write it in box 39 on your answer sheet.
39.  An alternative heading for the passage could be:

        A.  The protection of native flora and fauna
        B.  Influential factors in assessing survival probability
        C.  An economic rationale for the logging of forests
        D.  Preventive measures for the extinction of a species
Click the button to Show Answers.

Academic IELTS Writing task 1 Sample 5

IELTS Academic Writing Task 1/ Graph Writing - Column Graph:

» You should spend about 20 minutes on this task.

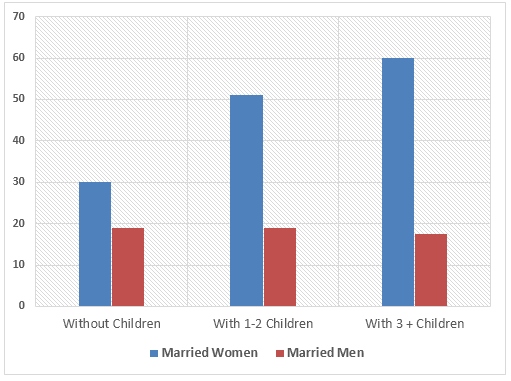
The diagram below shows the average hours of unpaid work per week done by people in different categories. (Unpaid work refers to such activities as childcare in the home, housework and gardening.)

Describe the information presented below, comparing results for men and women in the categories shown. Suggest reasons for what you see.
» You should write at least 150 words.
Unpaid work done by people in different categories

Model Answer 1:
The graph shows data between married men and women of the number of hours spent per week on unpaid work. At first glance at the chart, it is noticeable that from all the three categories (without children, with 1-2 children and with 3 or more children), married women spend more hours involved in unpaid work such as housework, gardening and childcare than expected from men.
Married women with children spend more time than without children as the chart shows while having more than three children have invested around 60 hours of unpaid work. This is probably due to the extra load of housework and childcare that is evidently needed to run such a big family.
Furthermore, though there are visible variations of the number of hours of unpaid work carried out by married women, there is no significant variation among all three categories for married men in terms of work hours that are not paid (30 or fewer hours). In fact, it is observed that married men with three or more children spent slightly less number of unpaid work hours. This might be due to the high requirement of commitment needed for a paid job to meet financial requirements for a big family.
In conclusion, married women with three or more children spent the highest number of hours, yet married women from all categories spent a dramatically higher number of hours for unpaid work than married men.
[Written by - Menu Anju ]
Tips for answering this Academic IELTS writing task 1:
1. Look at the question carefully. It asks you to compare the result shown for men and women. So you should not only mention the figures given in the graph. Rather you should use comparisons. An example of comparison is: "The number of unpaid working hours increases for women with the increase of their children's number but that does not affect the total unpaid works done by the men."
2. The question also asks you to suggest reasons for what you see. So you would require giving reasons possibly why the women work more unpaid works that men do and why their working hours in unpaid works increases with the number of total children.
3. There is an interesting fact in the result of the bar graph i.e. men with more than 3 children work even less for the unpaid jobs. Mention this interesting fact in your writing.
4. Since no past year or month is mentioned in this bar graph, your answer should be in present tense. Example: Women spend more time on such unpaid household works than men do.
Summary of the bar graph:
This graph shows the total hour of unpaid jobs like child rearing, household works, cooking, cleaning, gardening etc done by male and female per week. The result of this graph is not related to the paid job of men of women. The result suggests that females spend more time on such jobs than men do. Again, female with more children works more hours than other females. Interestingly the numbers of hours men work in such unpaid works remain almost same regardless of their children number.

Model Answer 2: 
The given column graph elucidates the unpaid work done by both married men and women having different numbers of children. A cursory glance is adequate to mention that most women, with or without children, have to do the unpaid household works more than men and more children mean more work for women.
As is seen in the given illustration, married females who do not have any child do around  30 hours of unpaid work weekly, while,  male from the same category do only 18 hours of such work. Whilst, men who have one or two children spend an equal amount of time for household works as do the males without children, this is in contrast nearly fifty hours for women. In the case of women, who nurture more than three offspring, spend the highest hours on unpaid works -58 hours per week. Men on the other hand, surprisingly do fewer household works with the increase of their child number.
[Word count = 152]

Academic IELTS Writing task 1 Sample 4

IELTS Academic Writing Task 1/ Graph Writing - Bar/Column Graph:

You should spend about 20 minutes on this task.

The chart below shows the amount of leisure time enjoyed by men and women of different employment status.

Write a report for a university lecturer describing the information below.
You should write at least 150 words.

Leisure time in a typical week in hour - by sex and employment status, 1998-99.

Leisure time enjoyed by men & women of different employment status
Model Answer 1:
The provided chart shows the number of leisure hours enjoyed by men and women in a typical week in 1998-99, according to gender and employment status. As is observed from the graph, the unemployed and retired men and women had more leisure time than the other type of people.

Among the full-time employed people, men had about 45 hours of leisure time on an average per week compared to the 38 hours of leisure time for women. No data is given for the part-time employed men and women from this category enjoyed 40 hours of leisure time in a week. This figure is slightly more than the employed women perhaps because of their employment nature.

Unemployed and retired people had the longest period of leisure activity both for men and women and men had a bit more hours than the women. As expected the retired and unemployed people enjoyed about 78 to 82 hours per week which is longer than people from other employment statuses. Lastly, housewives enjoyed approximately 50 hours of leisure time which is more than the employed women but less than the unemployed and retired women. The graph reflects that men had more leisure time from all employment statuses than women which indicates that women spent more time working at home than their male counterparts.

The graph summarises that the male enjoyed more leisure time than women and employed people had less time for leisure activities than retired and unemployed people. 
(Approximately 244 words)

Sample Answer 2:  
The graph compares the amount of leisure time enjoyed by people of different employment levels in a typical week in the year 1998-1999.
In the given column graph, no data has been provided for the part-time employed and house-staying men. For rest of the cases, Men have more leisure time than women of the same category.  The highest amount of leisure hours is enjoyed by those, who are unemployed. Unemployed men had approximately 85 hours of spare time and women from the same category had about 83 hours. The retired people also enjoyed the same amount of leisure activities as did the unemployed men and women.  On the contrary, full-time employed men had a total of 40 hours leisure time compared to about 37 hours of women from the same status. Finally, women with part-time jobs had 40 hours to spend for their leisure activities and housewives had 50 hours leisure time per week.In conclusion, unemployed and retired people, both men and women enjoyed more leisure time than employed people and men compared to women had more time for leisure activities. 
(Approximately 181 words